January 5, 2026: After 5 years focusing on IoT, Hitechdb LLC has ended it’s work in the IoT space and is pivoting to a new direction. The pages below are left for archival purposes.
Hitechdb LLC is an IoT consulting company specializing in dashboard design, data visualization, sensor selection, and deployment. With a wealth of expertise in these areas, we empower businesses to leverage the full potential of IoT technology. Our skilled team excels in creating intuitive and visually compelling dashboards that enable businesses to gain actionable insights from their data. Leveraging platforms such as Helium and The Things Network (TTN), we have successfully implemented robust and secure IoT systems that drive efficiency and productivity for our clients. Let Hitechdb LLC be your trusted partner in unlocking the transformative power of IoT.
We Can Help You With
- Getting started with IoT
- Sensor selection
- System design and deployment
- Dashboard design and implementation
Live Dashboards
- Meyer Rosenbaum – Indoor environmental monitoring of temperature and humidity conditions shown over a building schematic
- Meyer Rosenbaum – detailed view – Indoor environmental monitoring of temperature and humidity conditions with min, max, average, and history
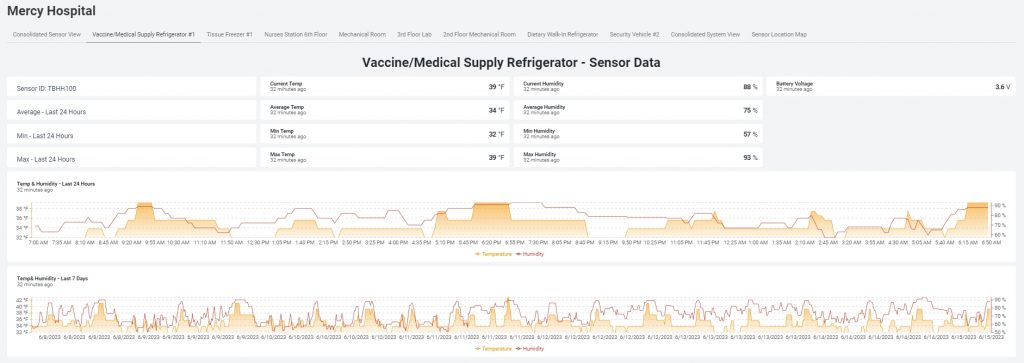
- Mercy Hospital – Prototype IoT system for a medical facility
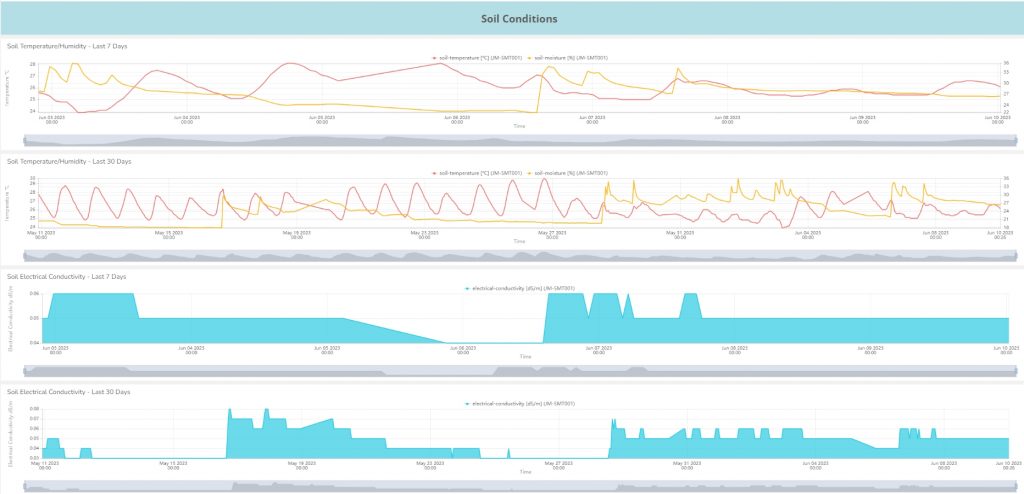
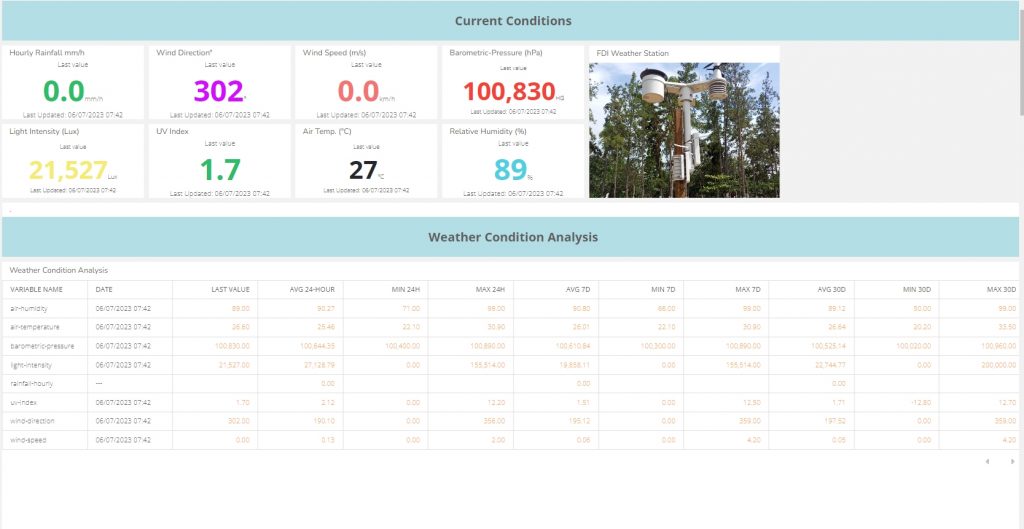
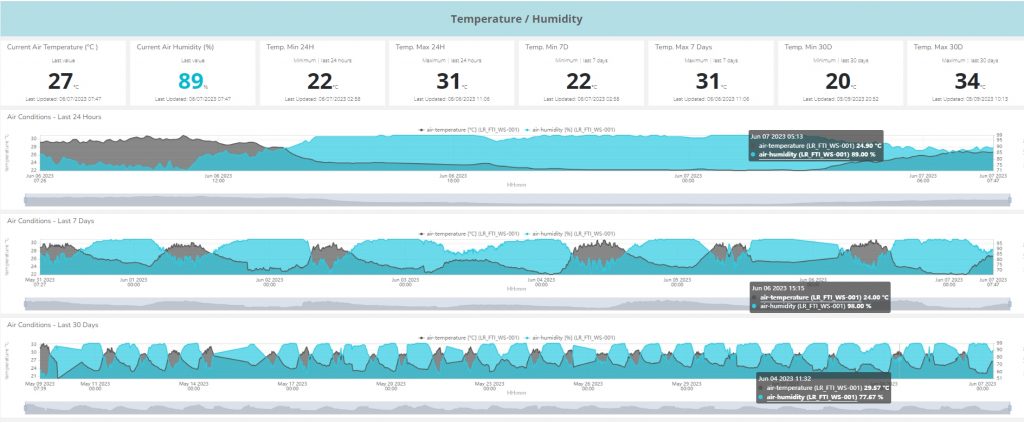
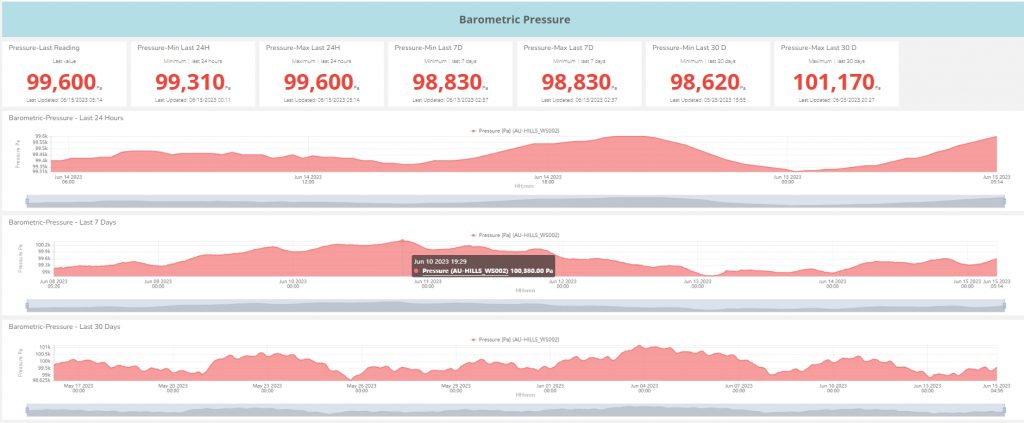
- Sunrise Family Farm – Prototype IoT system for a small farm
- Livingston Home – Prototype IoT system for a large home
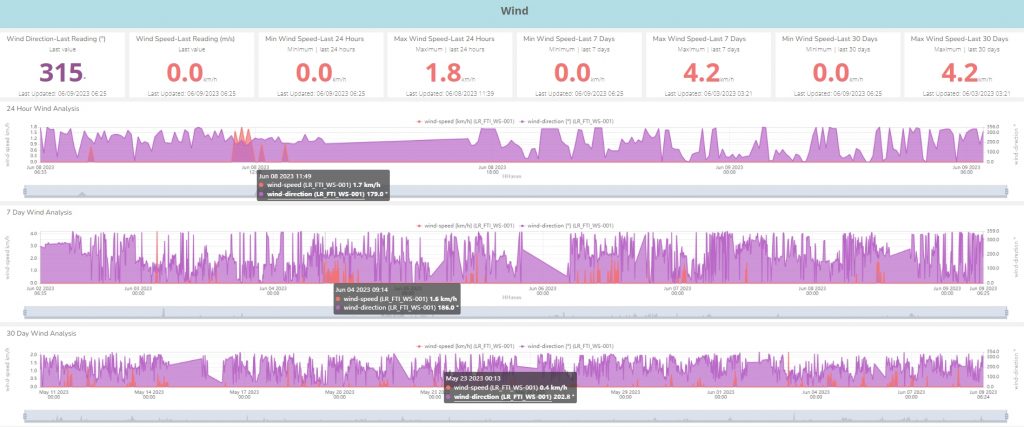
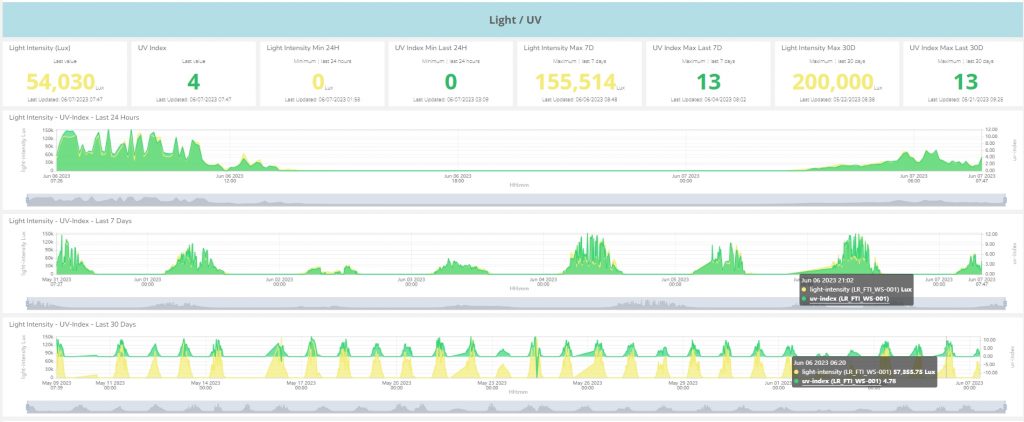
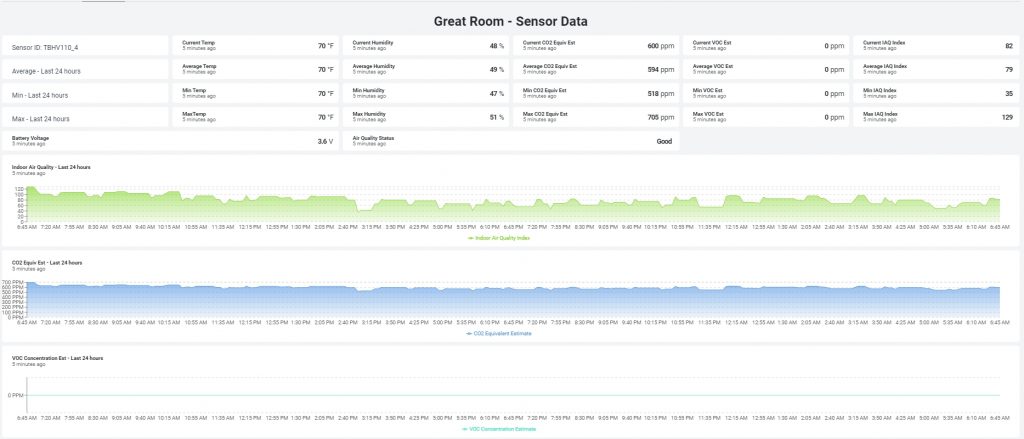
- Systems Performance Dashboard – Performance Monitoring for various IoT systems
If you are wondering how IoT technology can help your business or need help with an IoT project, please reach out to us at info@hitechdb.com.
Featuring
 |
 |
 |
||
 |
||||
 |
 |
|||
 |
|
|
|
Data Visualization
 |
 |
 |
 |
 |
 |
 |
 |
|
|
|